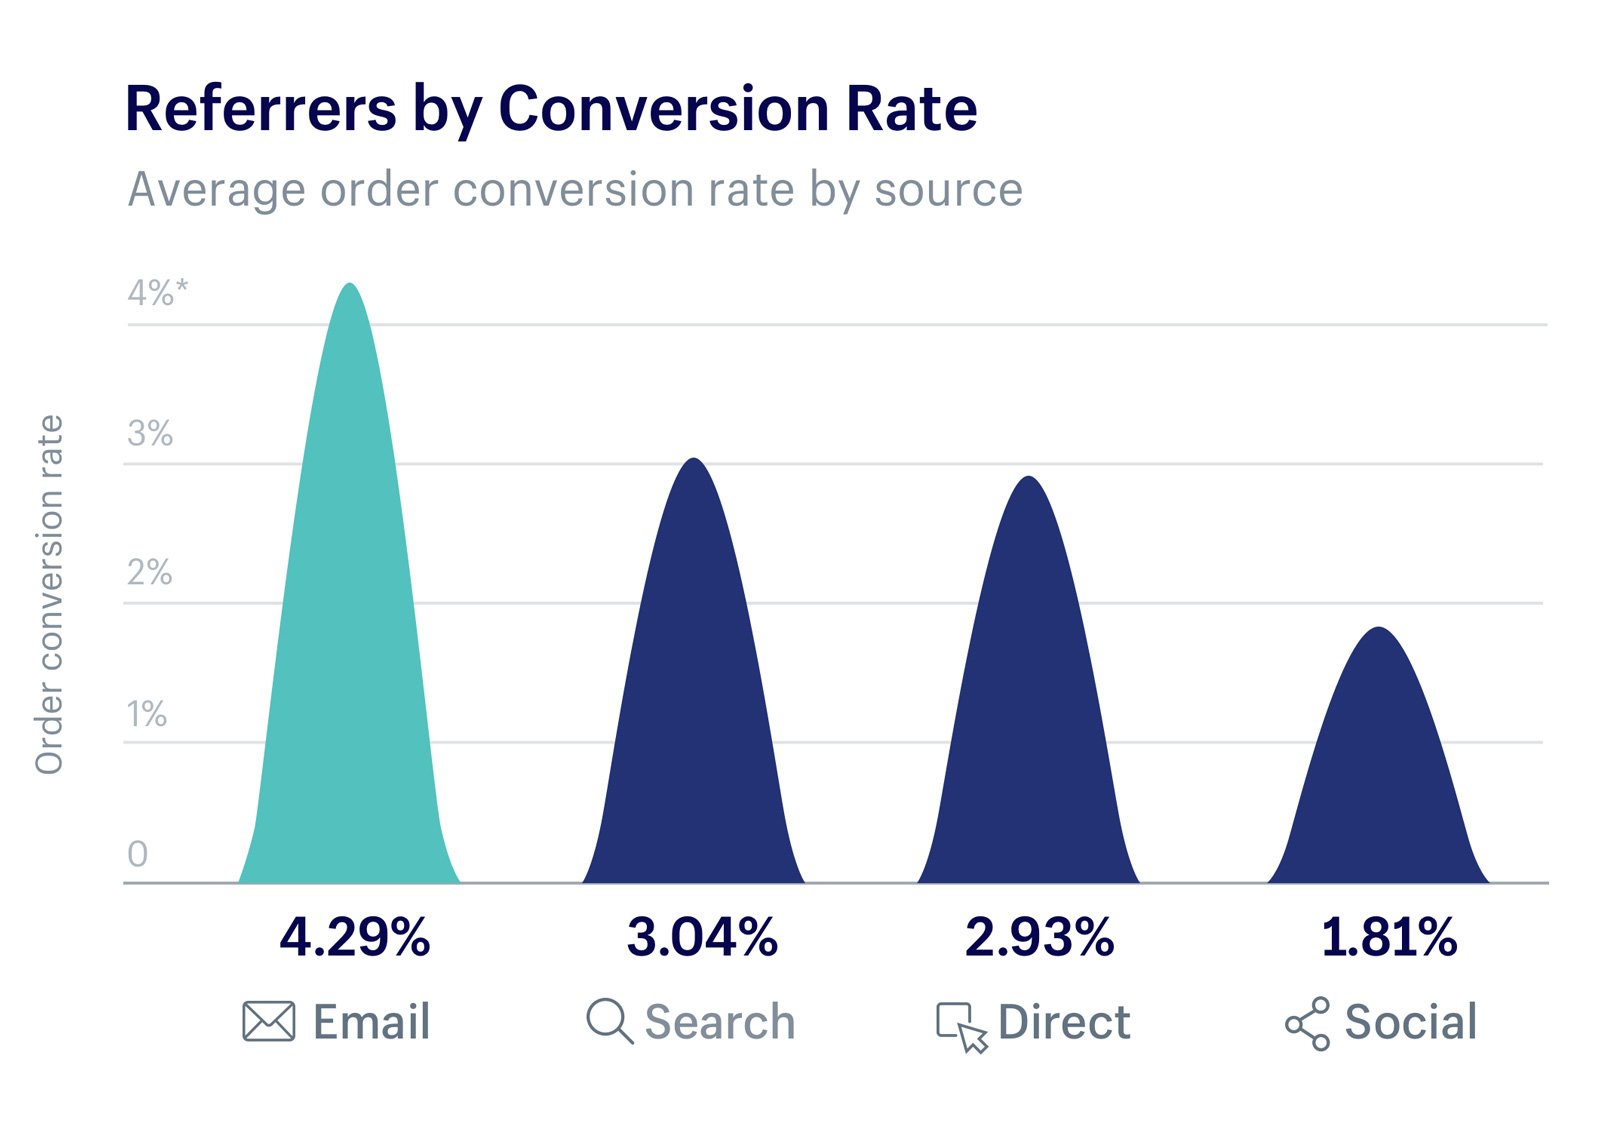
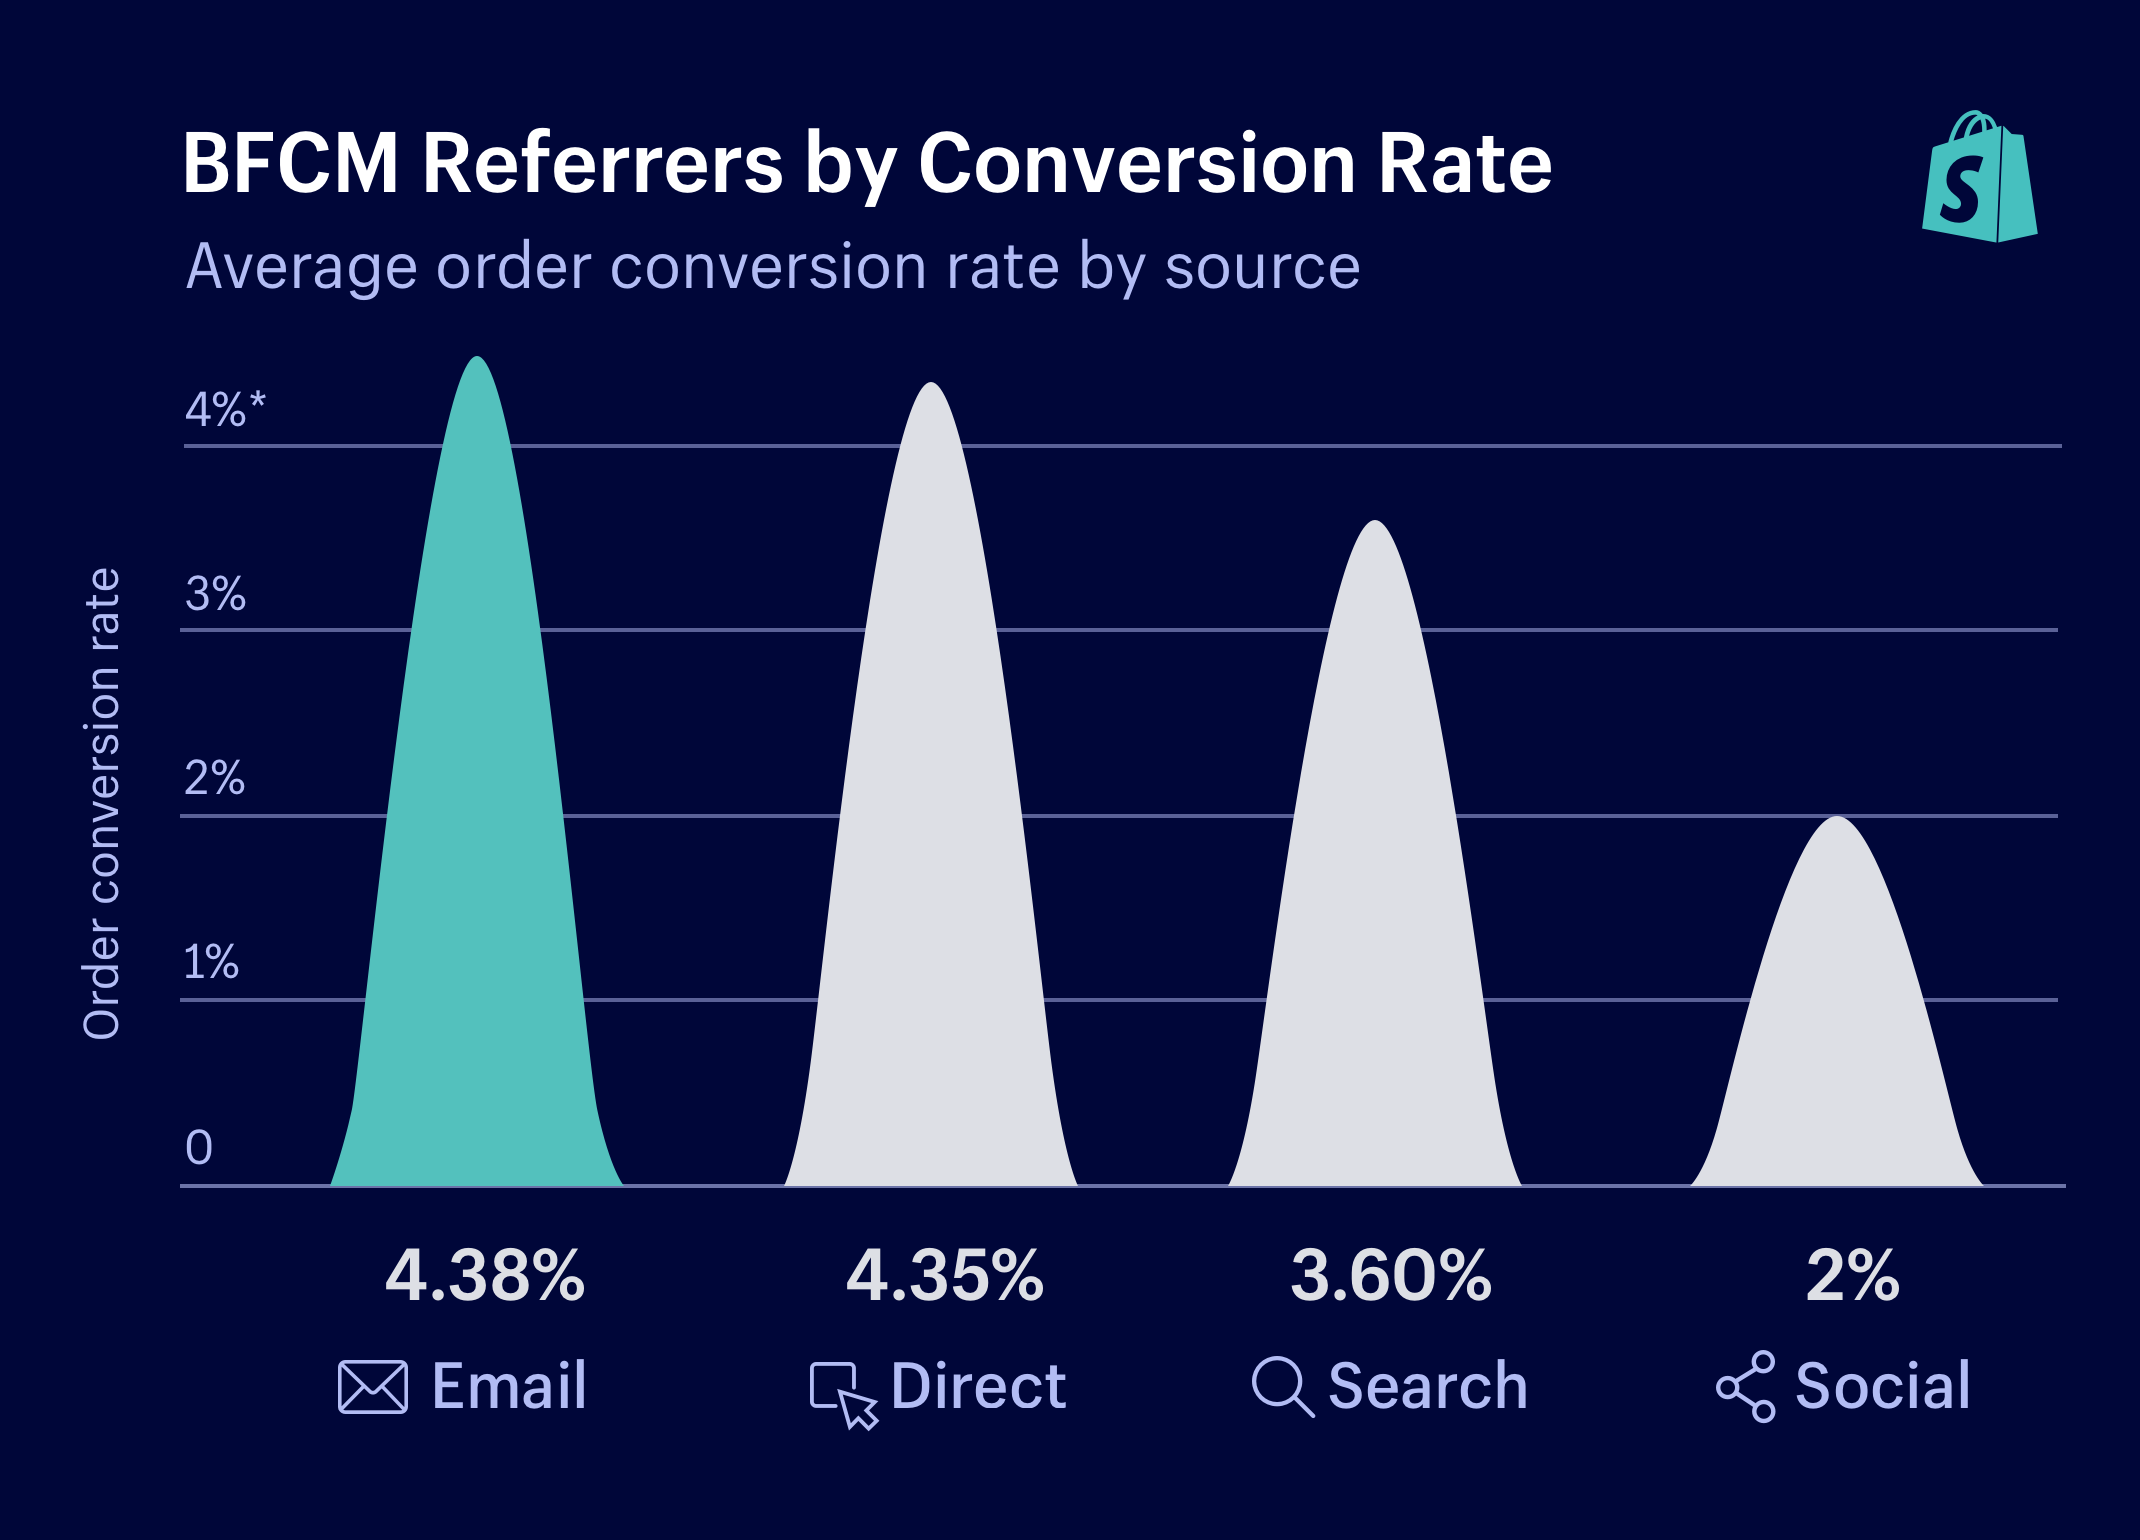
With Shopify releasing their 2018 Black Friday to Cyber Monday stats recently, I wanted to compare them to last years.
The first one I'm interested in is the conversion rate by source. Conversion rate is such a key metric for your business that it's an important one to watch.
The marketing channel also tends to have the most significant impact on the conversion rate and later customer behavior.
Luckily Shopify made this comparison easy.

- Email 4.29%
- Search 3.04%
- Direct 2.93%
- Social 1.81%

- Email 4.38%
- Direct 4.35%
- Search 3.60%
- Social 2%
Right away let's ignore Direct traffic. That's traffic that doesn't have any referrer data and it's commonly a mix of all sources (e.g. email, search, social, ads, lions, tigers, bears).
Email from 4.29% to 4.38%.
Email is still the top converting channel on Shopify and in many other places. Even with the headlines claiming email is dead, it still converts better than anything else. Plus it's also a very inexpensive and easy to track channel.
You absolutely should be using email as much as you can. Monthly, weekly, or even daily newsletters, deals, events, abandoned carts, replenishment reminders, win-back campaigns... There's always ways to email more.
Search from 3.04% to 3.60%.
This year search conversions got a large boost. It could be from better quality mobile search results, better SEO done by stores, or that my JSON-LD for SEO is installed on more stores (haha).
Using search is a long-term, snowball strategy but these conversions show that it's a powerhouse.
Remember, this is traffic that came from search and then bought. Not came from search, signed up for your email newsletter, and then came back later on their own.
Social from 1.81% to 2%.
A decent improvement over last year, perhaps due to the consolidation of social media properties and their ever-expanding features.
One data nitpick: Social is the only stat in 2018's data that isn't using two decimal places. This makes me wonder if someone rounded Social up to a nice even 2%. Even search's rate had two decimal places and it ended with a 0. #social-conspiracy
What wasn't shown are paid traffic and advertising. Shopify didn't mention if these are only organic/natural channels or if paid traffic is included in these metrics or if paid traffic ranked lower and was excluded from the graph.
Now lets consider the bigger picture just from this data.
If all you focused on was these three channels you could built a significant store. Email and search have long-term staying power and social, though weaker, could give you spikes of awareness and sales in the short-term. A nice peanut-butter and jelly, with a side of chips situation.
The three channels also divide up quite nicely if you wanted to split your time based on the conversion rate "weights".
- Email should take a bit over 40% of your marketing resources
- Search should take a touch under 40% of your resources
- Social should take the remaining 20%
Practically speaking email will take far less unless you group content marketing into email. In that case, creating the content will help both email and search channels. A nice two-for-one deal if you ask me. (That's also my exact strategy I use)
Now as with any limited view on single points of data, this might not apply to your store or it could be wildly off.
But having seen this, you should be able to perform a similar analysis on your store's actual data. Whatever your numbers say, that's pure-gold data.
Conversion rate is just one data point to consider with your store. It's an important one but it's even better combined with other metrics.
Repeat Customer Insights can pull even more metrics from your store, all automatically and without your input or having to configure anything.
It'll also use those metrics to give you actionable advice on where to focus on and what to improve. And the customer segmentation is designed to be easy to import into your email marketing system.
Eric Davis
When are your customers defecting?
Are your customers defecting? Use Repeat Customer Insights to find out where in their lifecycle you're losing them.