Your Shopify store's repeat purchase rate shows you how loyal your customer base is. The more customers who come back and buy two, three, or even ten times, the more loyal and valuable each customer is.
What is Repeat Purchase Rate?
The repeat purchase rate measures the percentage of your customers who come back for another purchase.
This can also be called your repeat customer rate, re-order rate, or even customer retention rate.
Your repeat purchase rate will always range from 0% to 100%, with the higher the number the better. A rate of 0% means that none of your customers are coming back, a rate of 100% means every customer comes back and makes another purchase.
The number of purchases the customers make isn't tracked by this metric. You'll want to use the Average Orders per Customer for that.
Calculate your Repeat Purchase Rate in Shopify
Calculating your repeat purchase rate in Shopify is pretty easy. For this example we'll do it for a single month but you can do it for any time period, including the entire time your store has been in business.
The longer the time period, the better your rate should be. That's because there's a wider timeframe you're looking for repeat orders in.
1. Find the number of customers who have placed an order
First you need to count how many customers have placed an order.
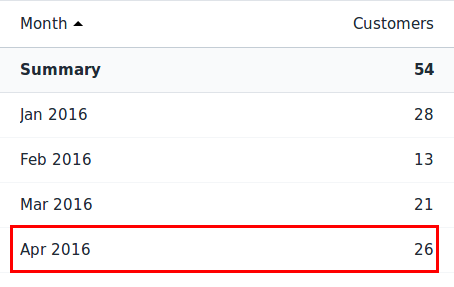
You can use the Customers over time report for this. Make sure to remove all filters.

In the example above, there are 26 customers for the month we're looking at.
(Depending on your Shopify customer configuration, you might have customers in your database who have placed 0 orders. Ignore them, they shouldn't be used in this calculation as they aren't technically customers yet.)
2. Find the number of customers who placed a repeat order
Next you need to count how many customers whose order was a repeat order.
The closest report for this is to:
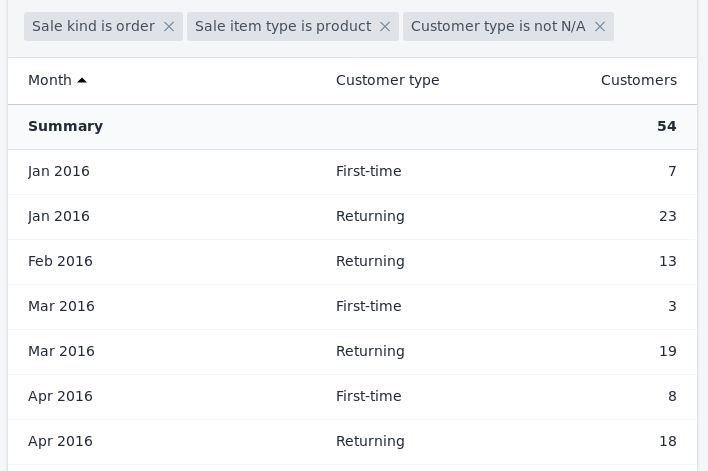
- use the Customers over time report again
- make sure the Customer Type column is enabled
- Look for the number of Returning customers for the month

For the example above, that would be 18 customers (last row).
3. Divide
Finally divide the repeat customers (#2) by the total customers (#1).
 Repeat customers
------------------
Total customers
You'll end up with a decimal number from 0 to 1. Multiply that by 100 to get your percentage.
In this example 18 / 26 = 0.69 so the repeat purchase rate is 69% for that month.
Caveat: Shopify measures historic returning customers incorrectly
Due to how Shopify measures Returning customers, this Repeat Purchase Rate will be over-stated. It's a tricky bug that I found in their reporting a long-time ago and they haven't address it yet.
I'd recommend using the Repeat Purchase Rate from my app instead. It sequences customer data and avoids the measurement bug in Shopify reports.
Industry averages and trends
Each industry has different levels of "good" rates and each store will be different depending on the product mix and which customer segments you're targeting.
The more subscription or consumption-based products you sell, the higher your repeat rate should be. Stores selling more durable products tend to have a lower reorder rate. Stores with larger product catalogs will also tend to have a higher rate because there is a greater selection of products to drive customers back to your store.
That said, a repeat purchase rate from 20-40% is a good range to be in. Shopify has found that a 27% repeat purchase rate is considered a good baseline and that's what I use in the analysis inside of Repeat Purchase Insights.
Repeat Purchase Rate impact on revenue
At first glance there's appears to be a simple relationship between repeat purchase rate and revenue.
The more customers come back, the more revenue. Right?
Close.
Repeat purchase rate is a compounding metric.
In the example above we only looked at the overall rate for a store. But some of those customers purchased multiple times.
Just like how a customer who orders twice is more valuable than a customer who only orders once, a customer who orders three, four, or even five times is more valuable.
What happens is that your repeat purchase rate also applies for customers who are placing their third order, fourth order, etc. That means if you have a 30% rate, for every 100 customers, you'll have:
- 100 first orders
- 30 second orders (100 * 30%)
- 9 third orders (30 * 30%)
- 2 fourth orders (9 * 30%, rounded down)
That's 141 orders from 100 customers. 11 more than what the simple first order repeat purchase rate predicted (130 vs 141).
That's because the more customers your store has and the higher the rate, the more repeat orders that they end up making over their lifetime.
At higher rates, the majority of your revenue each month could come from repeat customers. That's a huge win for you in light of the always increasing cost to acquire customers.
Intra-order Repeat Purchase Rates
To make it even more interesting, you can also measure the precise repeat purchase rate for each order step. This means instead of looking at your store as a whole, you look at the transitions a customer makes from their 1st to 2nd order, their 2nd to 3rd order, and so on.
This is more difficult because it seems Shopify has removed this report so you'll have to download an Excel file of your customers and crunch the numbers by hand.
You'll want to calculate how many customers have had at least X orders. For example:
- at least 2 orders
- at least 3 orders
- at least 4 orders
Using that you can work out the repeat purchase rates for each segment based on the number of orders. Using my data:
- 1st to 2nd order repeat purchase rate (also the overall rate): 30.7% ( 8 customers placed at least 2 orders / 26 customers placed at least 1 order )
- 2nd to 3rd: 25% ( 2 customers placed at least 3 orders / 8 customers placed at least 2 orders )
- 3rd to 4th: 50% ( 1 / 2 )
- 4th to 5th: 100% ( 1 / 1 )
- and so on
Running that through the math machine would end up with the same 143 orders per 100 customers.
But the huge new insight is where the rate is weak. Look above and you'll see a weak 2nd to 3rd rate. If that was improved, more customers would flow down to the next stage and you'll get more customers ordering.
Pretty powerful right?
The full analysis is difficult to show because of all of the math involved and it can require an advanced spreadsheet or software to crunch all the data. But some amazing insights can come out of it, especially once you start doing customer segmenting based on behavior.
From my analysis of millions of orders in my Shopify app, stores who get above a 35% repeat purchase rate start to see significant impacts on their bottom-line revenue. They also tend to get a lot more reorders over the customer's lifecycle.
This intra-order analysis, combined with a customer purchase latency analysis can be really valuable. You'd learn and measure how well your retention campaigns are working as well as know where they need to be optimized at.
Measure and track your Repeat Purchase Rate
My advice to you is to measure and track your repeat purchase rate. Even the basic overall metric can be valuable and it'll let you make a lot more powerful decisions around your store's marketing and promotion.
More advanced stores can look at the Intra-order rates to identify optimizations that are suitable for targeting with specific campaigns (e.g. segmenting those customers into a "5th order incentive" campaign).
Get a snapshot of your customer behavior
The sooner you signup for Repeat Customer Insights, the more comparison points your store will have. Each 1st of a the month a new snapshot is taken and saved to your account for analysis.