Today I want to teach you a bit about how to use your Customer Purchase Latency and campaign results to predict the future.
No crystal ball required.
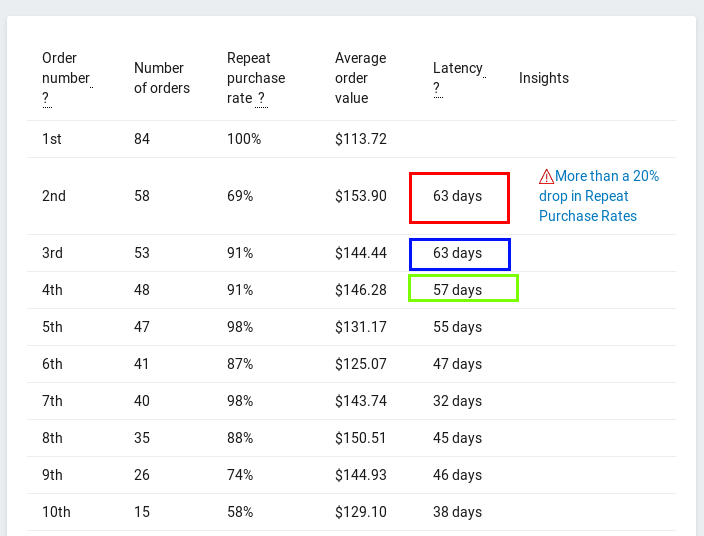
Let's use the data below as an example (if you have Repeat Customer Insights installed, feel free to follow along by looking at your own numbers)

The first key data point to look at is the latency between the first and second order (red box). This means that it takes about 63 days for a new customer to place their second order.
The second key data point is the Repeat Purchase Rate for the same row, 69%. That means 69% of the customers who placed the first order went on to place a second order.
Using those two pieces of analysis, let's pretend it's January and you've just run a major marketing campaign.
You ended up with 1,000 new orders this month.
Based on your latency, there's a strong chance you'll have another rush of orders in about two months in March. That's because 69% of those 1,000 customers will be placing their second order in about 63 days.
January 1,000 orders (from the first campaign)
February 0 orders
March 690 orders (from the first campaign's customers placing their 2nd order)
(Technically the latency of 63 days would push the orders into April depending on when in January the order was placed but I'm just using 60 days -> 2 months to make this concept easier to understand)
Now if you run a similar campaign next month (February), you might be able time it so that you get another spike in orders in-between the first campaign's 1st-to-2nd order. Do that again in March and you start to stack up the orders.
January 1,000 orders (from the first campaign)
February 1000 orders (from the second campaign)
March 1,000 orders (from the third campaign) 690 orders (from the first campaign's customers placing their 2nd order) =1,690 orders total
April 1,000 orders (from the fourth campaign) 690 orders (from the second campaign's customers placing their 2nd order) =1,690 orders total
May 1,000 orders (from the fifth campaign) 476 orders (from the first campaign's customers placing their 3rd order) 690 orders (from the third campaign's customers placing their 2nd order) =2,166 orders total
... etc, etc
Keep doing this and you could string together a very solid set of months with high sales.
Predicting and forecasting customer behavior, let alone human behavior, is difficult so this won't be an exact science.
But by using your store data and the results from a campaign, you can start to make a rough sales forecast.
If you don't know your latency or repeat purchase rate, they are core metrics from Repeat Customer Insights.
It'll even calculate them for each repeat order which can make your forecast even better as customers tend to accelerate their repeat purchases the more often they buy from you.
Eric Davis
Which marketing strategies are producing the best customers for your store?
Analyzing your customers, orders, and products with Repeat Customer Insights can help find which marketing strategies attracted the best customers over the long-term.