One small feature I added to Repeat Customer Insights was to show the percentages in the Customer Grid.
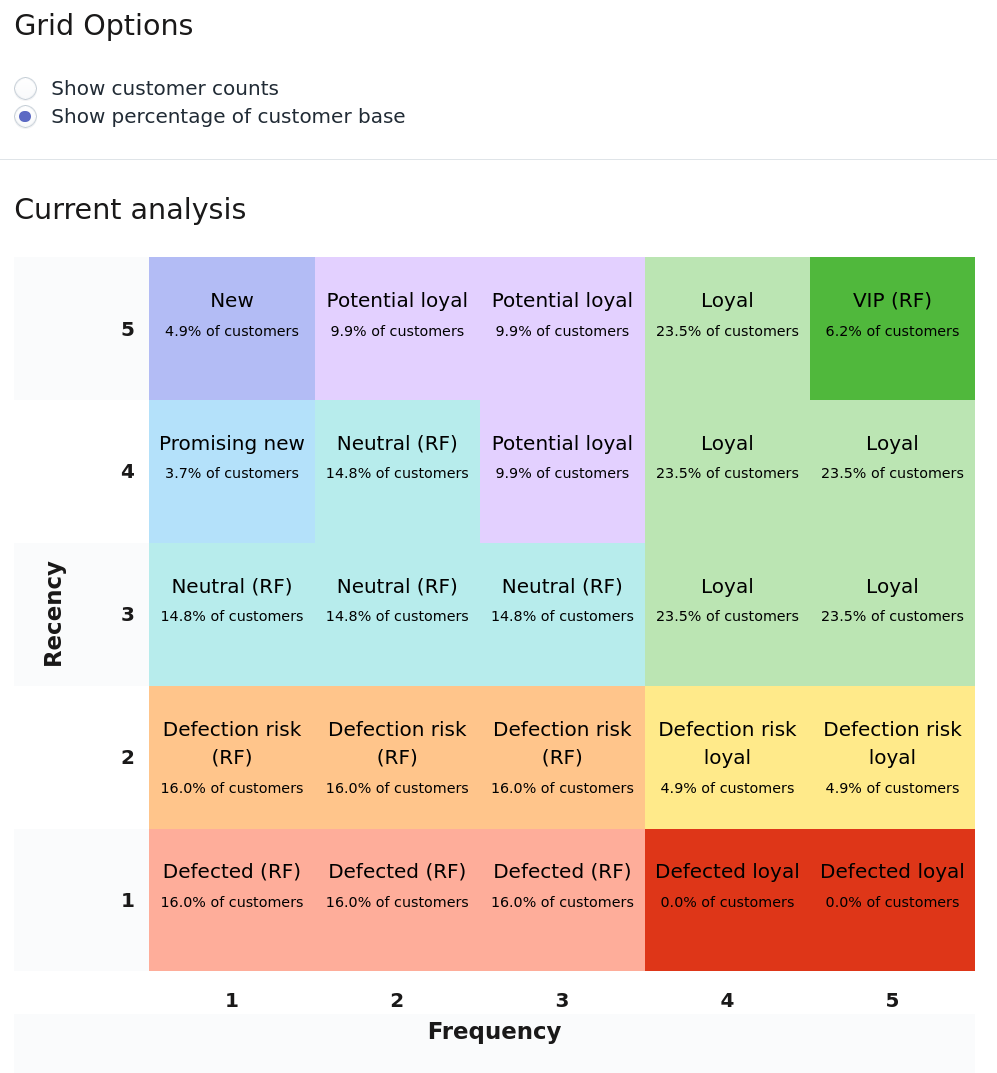
While intended to be used when comparing historic Customer Grids (to make them apples-to-apples), the percentage can be used separately. It'll show you where your customer bases falls into the different Automatic Segments.
The example grid above is showing signs of strong customer loyalty. Based on your numbers, you could spot trends towards defection or even the just a neutral state where some customers stick around and others slowly drift away.
That's one of the three Customer Grids included in Repeat Customer Insights.
Like I wrote about yesterday, this is one of those small improvements that wasn't mentioned in the big release I did but could have an out-sized impact on your store. All it would take is to login each month, write down the eye-catching segments and can see if they've grown or shrunk since last time.
(It would be even easier if you have the Customer Grid History or comparison in your account though, as that would save a snapshot of your grids automatically. You'd still want to make it a habit to login and check them regularly though)
Eric Davis
Optimize your promotion timing to save money and attention
Repeat Customer Insights will analyze a ton of customer behavior data for you, including their buying cycles.
If you knew exactly when the majority of your customers were ready to buy again, you can increase your orders and profit just by tweaking your message timing.