With the recent release of Repeat Customer Insights' Automatic Customer Segmenting feature, I was finally able to add a powerful visualization feature I've been wanting for awhile:

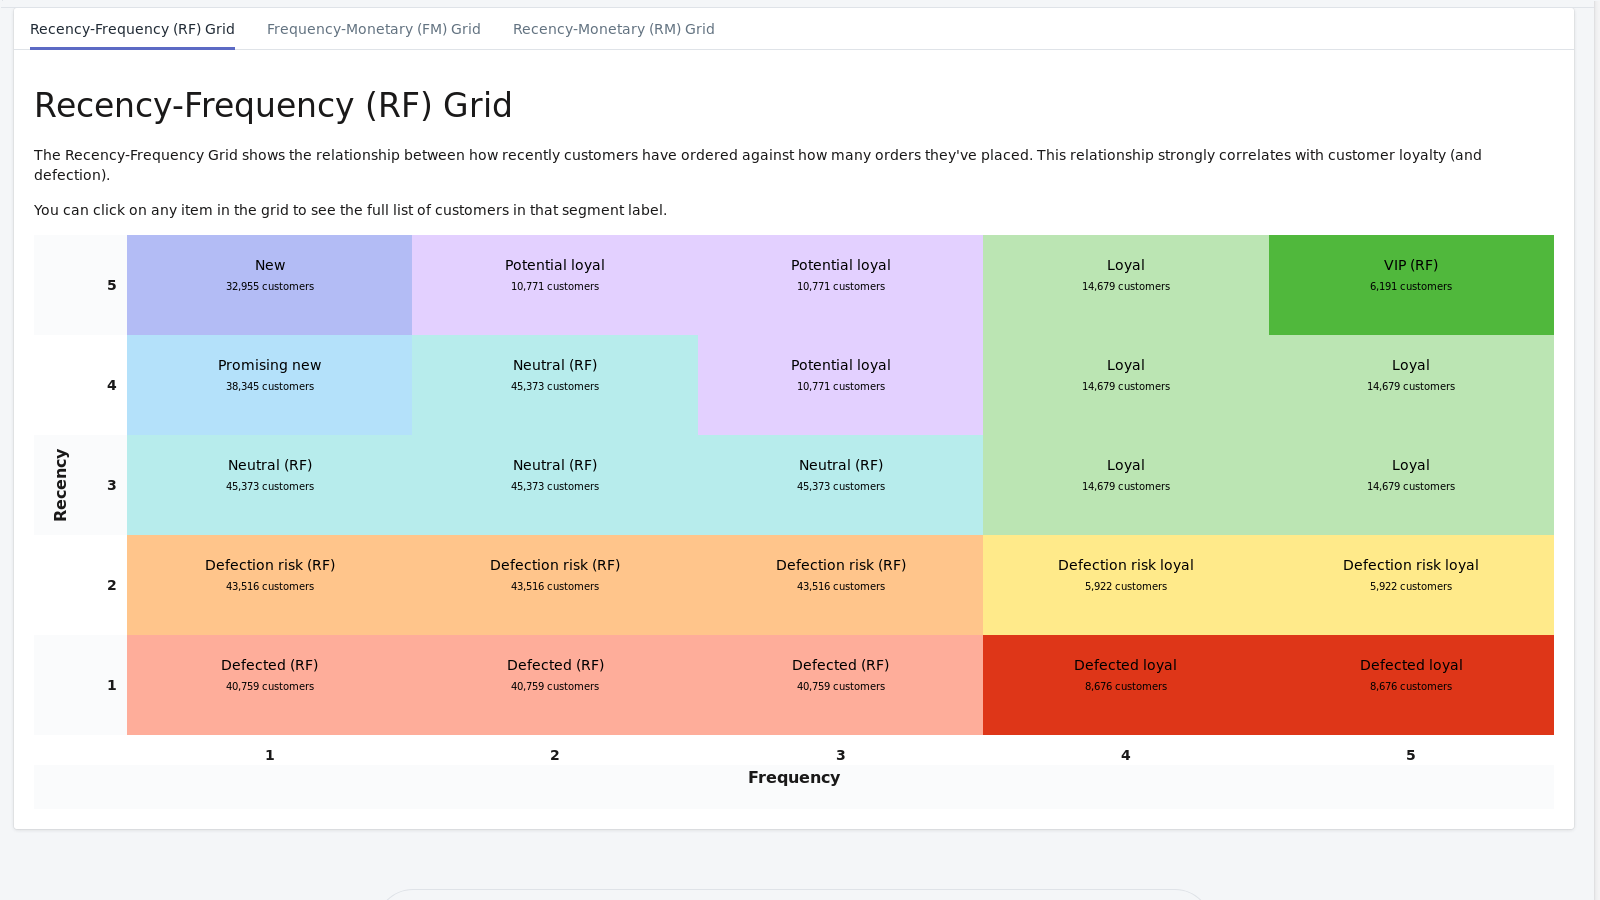
This is the Customer Grid.
It uses the same underlying RFM algorithm that powers the Automatic Customer Segmenting so it's completely automated.
This example compares the Recency and Frequency scores for customers, there are two other grids that compare the other RFM scores.
With the Customer Grid it becomes easy to get a birds-eye view of your customers to notice opportunities and problems.
For example, just looking at that example above you can see this store might have a problem with loyal customers defecting. There are about 20k loyal and VIP customers and almost 6k who where loyal but are in the process of defecting. Plus another 8k who have already defected.
Adding an anti-defection campaign or shoring up loyalty initiatives would be a good idea.
I'll be digging into these Customer Grids more in future articles. There are a lot of ideas and insights that can be pulled from these analyses.
Customer Grids are now available to all Repeat Customer Insights.
If you'd like to see what they can tell you about your store, just install Repeat Customer Insights and let it automatically import and build them for you.
Eric Davis
Do your holiday customers over or under-perform?
Big sales numbers look great in November and December but they can hide your true performance. Get the facts on how your winter holidays stack up with Repeat Customer Insights.